logo CNR-IBE
Search
Close this search box.

Coping with a complex phenomenon

Drought Observatory

Climate Services for the Mediterranean Basin Operational Services for decision makers, water management authorities and stakeholders.

WEBGIS, Monthly Bulletin – at present only available in Italian for Tuscany Region, and other services.
The complexity of the drought phenomenon requires the availability of a system as comprehensive and integrated as possible to respond to the different users requests.
//Category / Services
// Tags / drought

Why a Drought Observatory?

Increasing environmental resilience to cope with drought and reduce temporal gaps. Scientifically-based technical support to deliver simple, timely and reliable information. Drought monitoring supports a better resilience to reduce the impacts of drought events.

Proactive approach

Heat waves and droughts have important and increasing repercussions on physical, chemical and biological systems, and on some socio-economical aspects such as health, agriculture, natural ecosystems and tourism. 

One of the main challenge to cope with drought is to reduce the temporal gap between the onset and development of a dry period, and the response in managing drought-related emergencies.

Drought monitoring and forecasting system

The system provides a semi-automatic, detailed, timely and comprehensive operational service. This service, initially developed for Tuscany Region, supports decision makers, water authorities, researchers and general stakeholders

Meteorological stations network, satellite  images and models are integrated through an open source and interoperable SDI (Spatial Data Infrastructure) based on PostgreSQL/PostGIS to produce vegetation and precipitation indices to follow the occurrence and evolution of a drought event.

The system is based on a monitoring component and on a forecasting ones. It uses two type of indices:

  • direct climate-based indices.
  • indirect vegetation-based indices.

Main Features

Web GIS Drought

A WebGIS application based on open source solutions customized to integrate different datasets and share maps and graphs of drought indices with researchers, decision-makers and other stakeholders. Different functions allow to select sections of territory or visualize the trend of the indices in a specific pixel. Maps and graphs can also be downloaded in png format.

The Monthly Bulletin

The Monthly bulletin on Tuscan drought current and future conditions and local impacts. An Operational Services for decision makers, water management authorities and stakeholders to read updates on drought situation. At present the bulletin is issued only in Italian.

Open Data

Through CKAN and GeoServer, a complete catalogue to publish data and metadata in several formats and standard protocols. Spatial data can be integrated and reused by any third-party client application.

The SDI set up for the Observatory allows the dissemination of comprehensive, up-to-date information, customisable for different end users and delivered through different channels.

Services and Tools

Open Data

A complete catalogue (CKAN and GeoServer) with data and metadata in different formats and standard protocols. Any third-party client applications can easily reuse the spatial data.

web gis

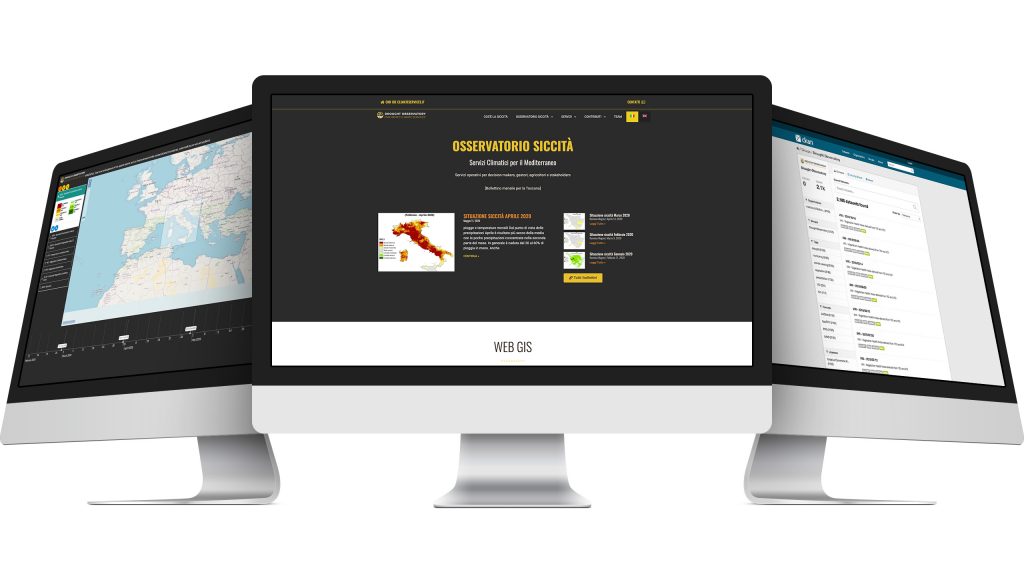
A customised Open Source WebGIS application to integrate different datasets and share maps of drought indices with researchers, decision makers and other stakeholders.

Monthly Updates

Monthly updates on Tuscan drought current and future conditions and local impacts, press releases and useful links. [The bulletin is issued only in Italian.]

RESTful APIs

RESTFUL APIs for data downloading, clipping and geoprocessing ensure the interoperability.

User Survey

The users’ survey collecting suggestions and needs on drought management and information, so to improve effectiveness of the drought operational services.​

Glossary

A selected list of drought related keywords. Sources: EarthLabs, Intergovernmental Panel on Climate Change (IPCC), National Drought Mitigation Center (NDMC).​

A Continuous Work-in-Progress.

The Spatial Data Infrastructure

New technical improvements in the ICT infrastructure, coupled with scientific advances, allow a timely, ready-to-use and users-specific upgrading of the early warning communication.

SOA | OGC | PostgreSQL

A Service-Oriented Architecture (SOA) based on Open Geospatial Consortium (OGC) standards. Database-centred architecture, with PostgreSQL DataBase Management System.

Innovative Approach​

The geographic data flows (from the download of remote sensing and climatic data to the storage of final indices) and all the related geoprocessing functions are integrated in a single environment.​

Advanced Statistical Procedures

The integration of the PL/R (R Procedural Language) wrapper into the procedural language of PostgreSQL (PL/pgSQL) allowed the creation of advanced statistical procedures using R engine.​

Videos

Play Video

Drought Observatory Part 3

Leandro Rocchi
Category: Drought Observatory, Services
Play Video

Drought Observatory Part 2

Ramona Magno
Category: Drought Observatory, Services
Play Video

Drought Observatory Part 1

Tiziana De Filippis
Category: Drought Observatory, Services