
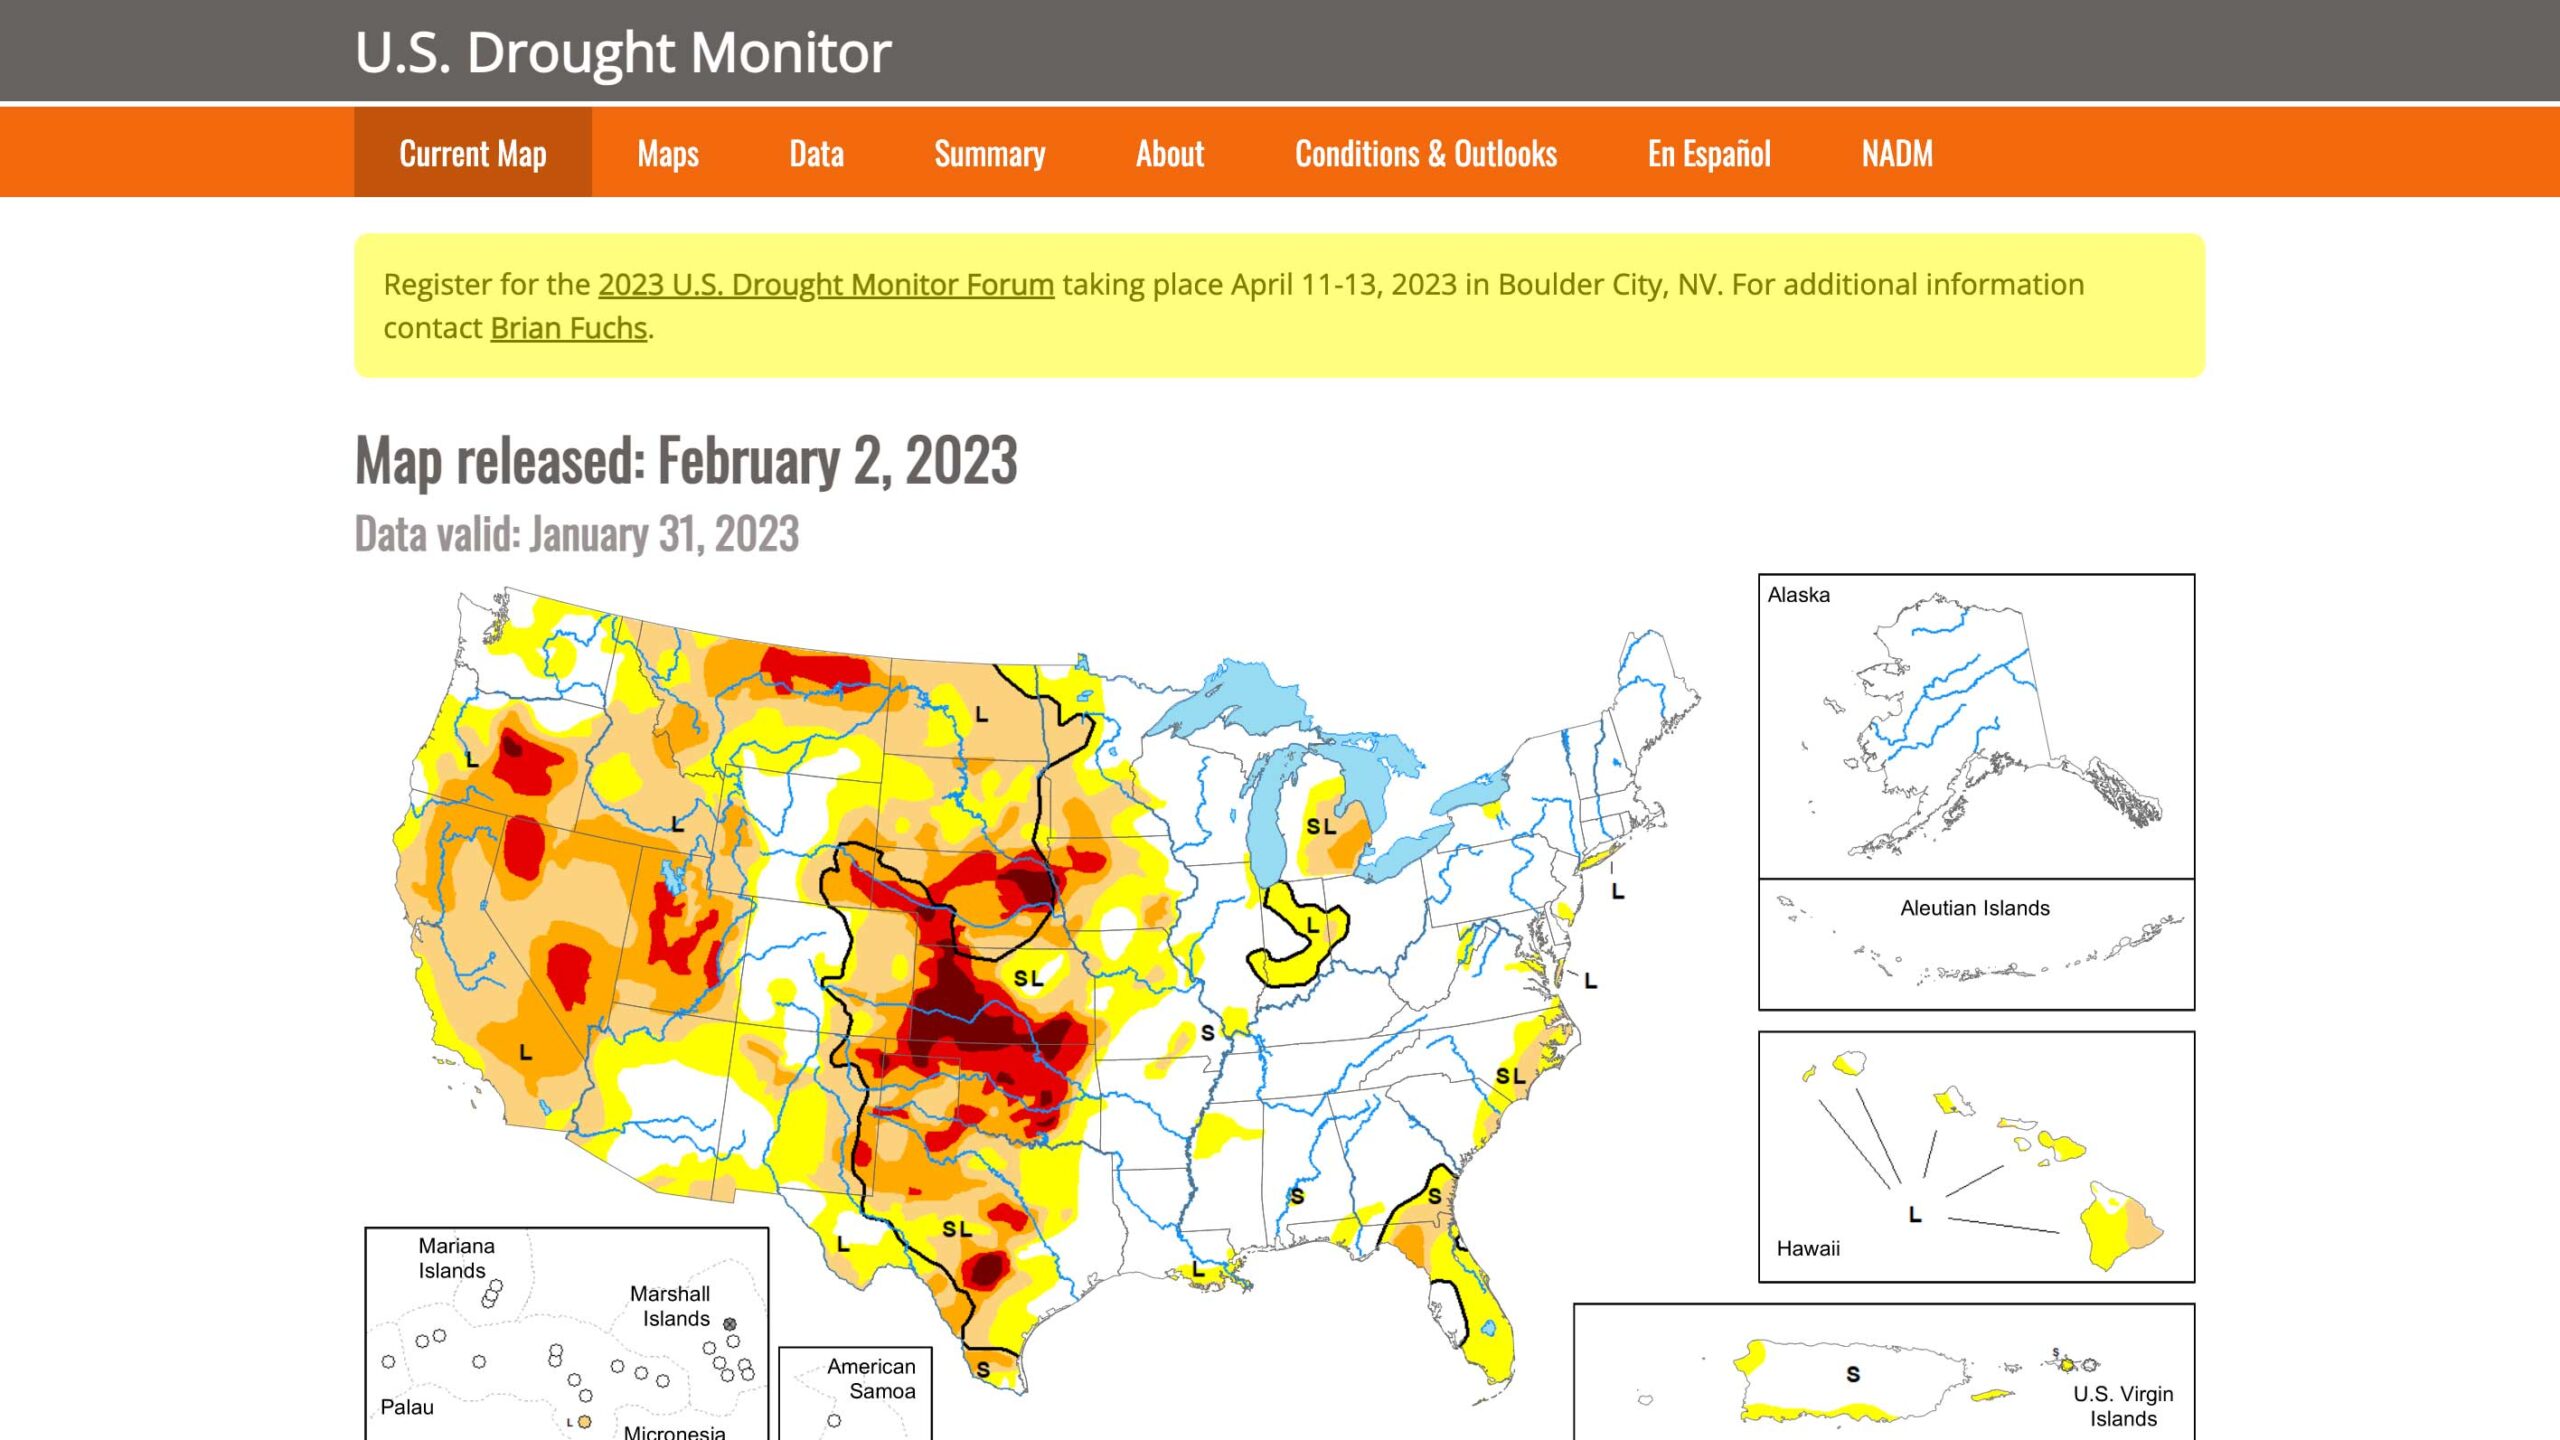
The U.S. Drought Monitor is a map released every Thursday, showing parts of the U.S. that are in drought. The map uses five classifications: abnormally dry (D0), showing areas that may be going into or are coming out of drought, and four levels of drought: moderate (D1), severe (D2), extreme (D3) and exceptional (D4).
The Drought Monitor has been a team effort since its inception in 1999, produced jointly by the National Drought Mitigation Center (NDMC) at the University of Nebraska-Lincoln, the National Oceanic and Atmospheric Administration (NOAA), and the U.S. Department of Agriculture (USDA). The NDMC hosts the website of the drought monitor and the associated data, and provides the map and data to NOAA, USDA and other agencies.
The USDA uses the drought monitor to trigger disaster declarations and eligibility for low-interest loans. The Farm Service Agency uses it to help determine eligibility for their Livestock Forage Program, and the Internal Revenue Service uses it for tax deferral on forced livestock sales due to drought. State, local, tribal and basin-level decision-makers use it to trigger drought responses, ideally along with other more local indicators of drought.